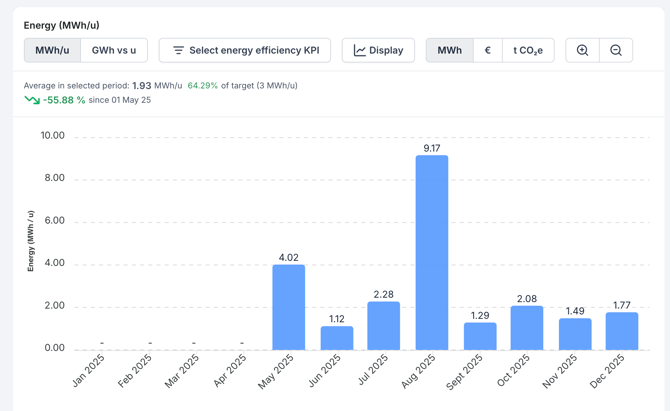
What is Energy per Unit Trends?
Energy per unit shows how much energy is consumed for each unit of production output, for example kWh/piece or kWh/kg. Under the ISO 50001 energy management standard, this kind of KPI is called an Energy Performance Indicator (EnPI).
Energy per Unit Trends builds these KPIs from your energy measurements and your production output numbers, and shows them over time.
To calculate the energy per unit for a specific batch instead a trend over time, see Energy per unit calculation.
Why use Energy per Unit Trends?
- Compare busy and quiet periods fairly: energy is normalized against output, so a high-production month no longer looks like waste.
- See efficiency drift early: energy intensity is shown per day or per month, not as a single snapshot.
- Find savings: rising energy per unit points to where efficiency can be improved and costs cut.
- Report under ISO 50001: energy per unit is an EnPI, so the KPI can be used directly for energy management reporting.
How to create an Energy Efficiency KPI
Create one KPI per production line, per product, or per asset type.
- Go to Energy Per Unit Trends.
- Click 'Create new energy efficiency KPI'. A setup dialog opens.
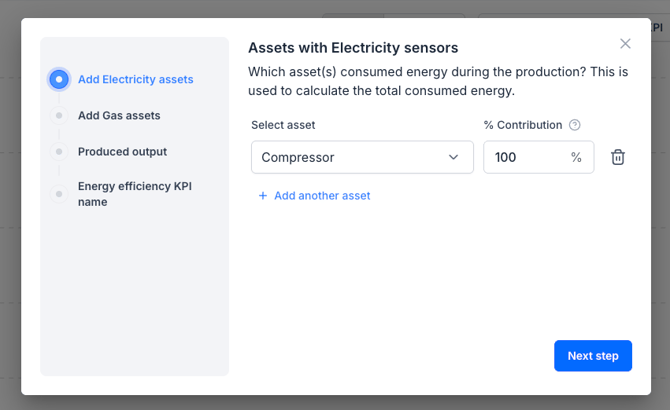
- Select electricity-consuming assets;
- (If applicable) Select the gas-consuming assets;
- (If applicable) Select the counting-assets that track your production output;
- Specify the output unit type (e.g., units, kg).
- (If applicable) Specify the frequency of the production output numbers (inputting daily figures or monthly figures).In the setup dialog:
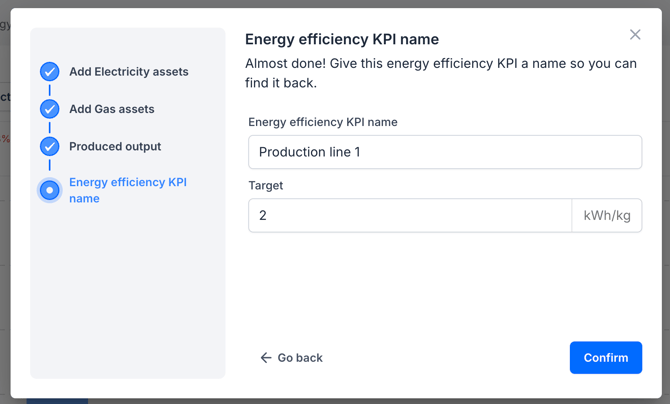
- Enter a descriptive name for the KPI.
- (Optional) Enter a target for the KPI.
- Click 'Confirm' to save the KPI.
Adding production output numbers to a KPI
A KPI needs production output numbers before it can show energy per unit. Enter them by hand in the side panel, or import them from a CSV file.
See Adding production output numbers to an energy efficiency KPI for both methods and the CSV rules.
Viewing your Energy Efficiency KPI
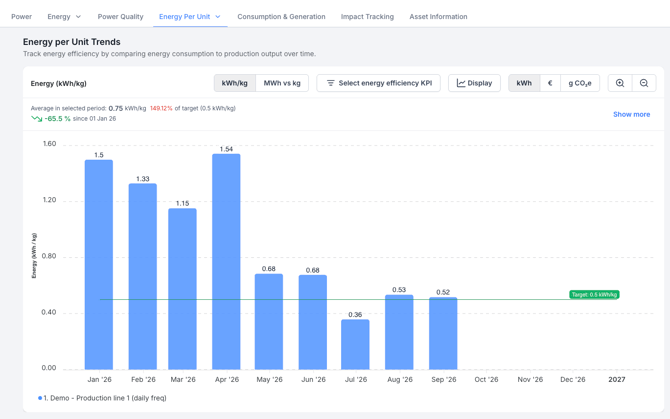
Your KPI appears on the Energy per Unit Trends graph. Use the top bar to:
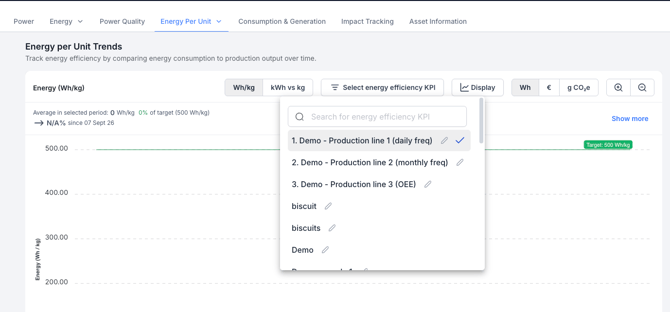
- Select the KPI you want to see.
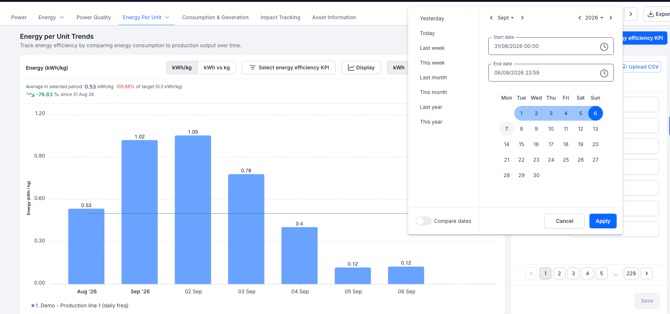
- Set the date range with the date picker.
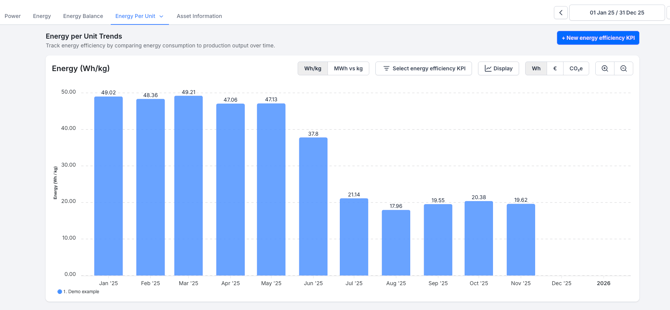
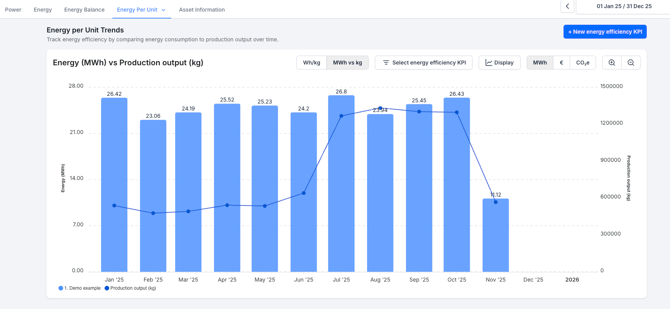
- Switch between two views:
- Energy per unit which plots the KPI itself, for example kWh/kg
- Energy versus produced units plots the two underlying numbers on one graph, each with its own y-axis. Total energy consumption is shown as bars. Total produced units is shown as a line over those bars. Use this view to see which of the two moved when the energy per unit changed.
- Energy per unit which plots the KPI itself, for example kWh/kg
- Enable 'Breakdown per asset' to see energy consumption per asset instead of the total.
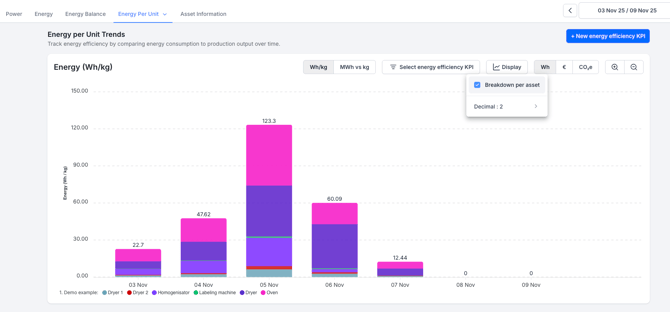
Three metrics above the graph summarize performance:
- Average in selected period: total energy consumed divided by total production output over the selected time range.
- Relation to target: your performance against the target you set, calculated as (Actual / Target) × 100%.
- Trend %: whether efficiency is improving or declining over the selected time range. It compares the first and last data points, as ((Latest value − First value) / First value) × 100%.