What is the Energy per Unit Trends feature?
Energy per unit is a key metric that shows how much energy is consumed for each unit of production output (e.g., kWh/unit, kWh/kg). This type of energy efficiency KPI is also known as an Energy Performance Indicator (EnPI) under the ISO 50.001 energy management standard.
The Energy per Unit Trends feature allows you to:
- Create energy efficiency KPIs that normalize energy consumption against production output;
- Monitor energy intensity over time;
- Identify opportunities to improve efficiency and reduce costs.
Do you want to calculate the energy per unit for a specific batch? Read here how you can setup this kind of calculation.
How to Create an Energy per Unit KPI
You can create one KPI per for example production line, per product, or per asset type.
- Navigate to the Energy Per Unit Trends menu.

- Click “Create new energy efficiency KPI.” A setup dialog appears.

- In the setup dialog:
- Select the electricity-consuming assets;
- (If applicable) Select the gas-consuming assets;
- (If applicable) Select the counting-assets that track your production output;
- Specify the output unit type (e.g., units, kg).
- (If applicable) Specify the frequency of the production output numbers (inputting daily figures or monthly figures).
- Enter a descriptive name for the KPI.
- (Optional) Enter a target for the KPI.
- Click 'Confirm' to save the KPI.

Adding Production Output Numbers to a KPI
You can add production output numbers to a KPI in two ways: manually or via CSV import.
Adding production output numbers manually:
- Open the right side panel in the KPI view.

- Locate the production output fields for your set frequency (daily or monthly).
- Enter the production numbers directly into the fields.
- Click Save.
Adding production output numbers via CSV import:
- Click the CSV import button. A dialog opens.

- (Optional) Download the example CSV file from the dialog
- Fill in your data using the exact column names: "Period" and "Produced Units"
- If using the monthly frequency: Set the "Period" date to the 1st of the month (e.g., 01/01/2026)
- Save your file as a CSV.
- Attach your file in the dialog and click Upload CSV

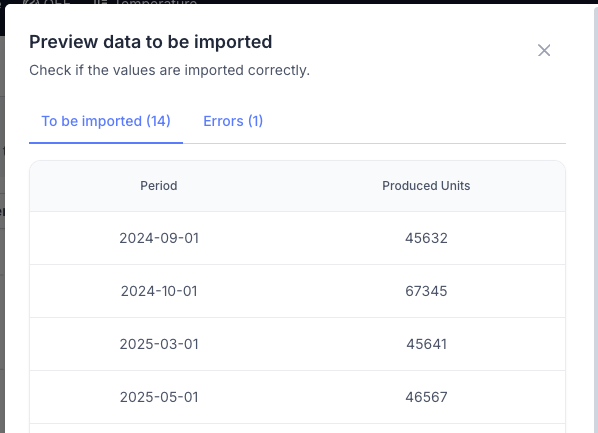
- Review the data in the preview window. Rows that cannot be imported are listed in the 'Errors' tab.
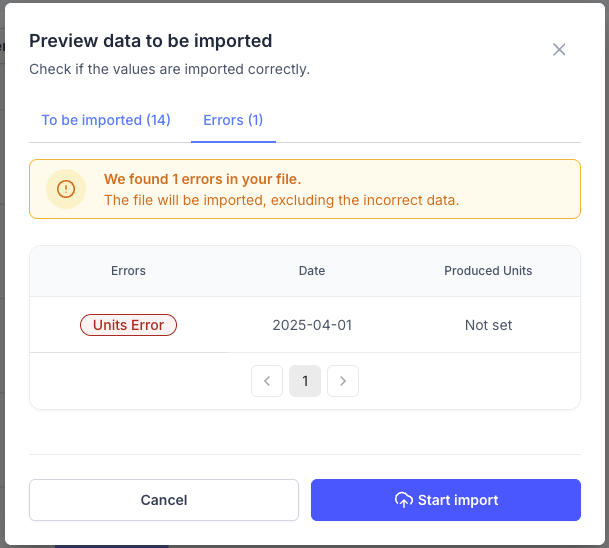
- Click Start import to import the data.
- A success modal will appear, showing the number of rows imported.

Any edits can be made later in the side panel, or via a new CSV import.
Tips and Tricks for CSV Upload
- Column names must match exactly, including capital letters: “Period” and “Produced Units”.
- Each period should appear only once. Duplicate periods (e.g., 2025-12-01 added twice) will prevent the upload.
- The Period must follow one of the following formats:
- yyyy-mm-dd
- yyyy/mm/dd
- dd-mm-yyyy
- dd/mm/yyyy
- d/m/yyyy
- d-m-yyyy
- When using the monthly frequency of the production output numbers, it's important that the day must always be set to the 1st. For example, if you want to import data from January 2026, you can use 01/01/2026, but you cannot use 15/01/2026.
Month Correct format Incorrect format May 2025 01-05-2025 14-05-2025 June 2025 2025/06/01 2025/06/28 July 2026 1/7/2026 15/7/2026 - Produced Units must be numbers, not text. Decimal numbers aren't supported yet.
- Only CSV files are supported.
Viewing Your Energy efficiency KPI
Once created, your energy efficiency KPI will appear on the ‘Energy per Unit Trends’ graph. The top bar in the graph allows you to:
- Select the KPI you want to visualize from the top bar on the graph
- Use the time picker to select your preferred time range
- Toggle between views:
- Energy per unit (eg kWh/kg)
- Energy versus produced units (eg kWh vs kg) to compare total energy consumption and production output, to get more context on the energy per unit numbers
- Enable ‘Breakdown per asset’ to view energy consumption per individual asset instead of the total
- View the three metrics at the top of the graph to help you evaluate performance at a glance:
- Average in selected period: This shows the total energy consumed divided by the total production output for your chosen timeframe
- Relation to target: This percentage compares your actual performance against your set goal. It is calculated as: (Actual / Target)*100%
- Trend %: This shows if your efficiency is improving or declining over the selected period. It compares the first and last data points using the formula: ((Latest Value - First Value) / First Value)*100%


