
What is Compare dates?
Compare dates is an option in the interval selector. It lets you pick two date ranges and view them in the same graph, so you can see the difference instead of switching back and forth between two views.
It is available in the graphs for Electricity, Gas, Compressed Air, and Water.
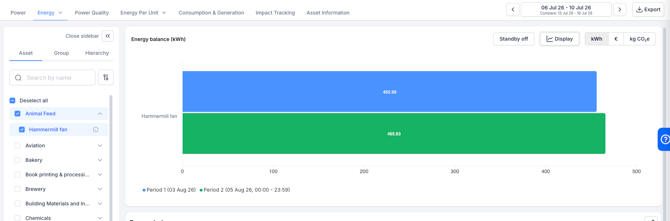
Why use Compare dates?
- Check whether a change worked: Compare the weeks before and after you adjusted a machine, a shift pattern, or a setpoint.
- Spot creeping consumption: Compare this month against the same month last year to catch a slow increase that a single view hides.
- Compare like with like: Line up two production weeks with similar output to see which one ran more efficiently.
Step-by-Step Instructions
- Open the graph for Electricity, Gas, Compressed Air, or Water.
- Open the interval selector.
- Enable the 'Compare dates' toggle.
- Enter the start date and end date of your first range.
- Enter the start date and end date of your second range. Note: both ranges must be the same length. A single range can cover up to 1 year.
- Click 'Apply dates'.

What if it doesn't work?
- A red message says the intervals have to be the same length — your two ranges differ. Adjust one of the end dates so both cover the same number of days, then apply again.
- The comparison looks odd even though the ranges match — check that both cover comparable production. A holiday week compared against a full production week shows a large difference that has nothing to do with the change you made.