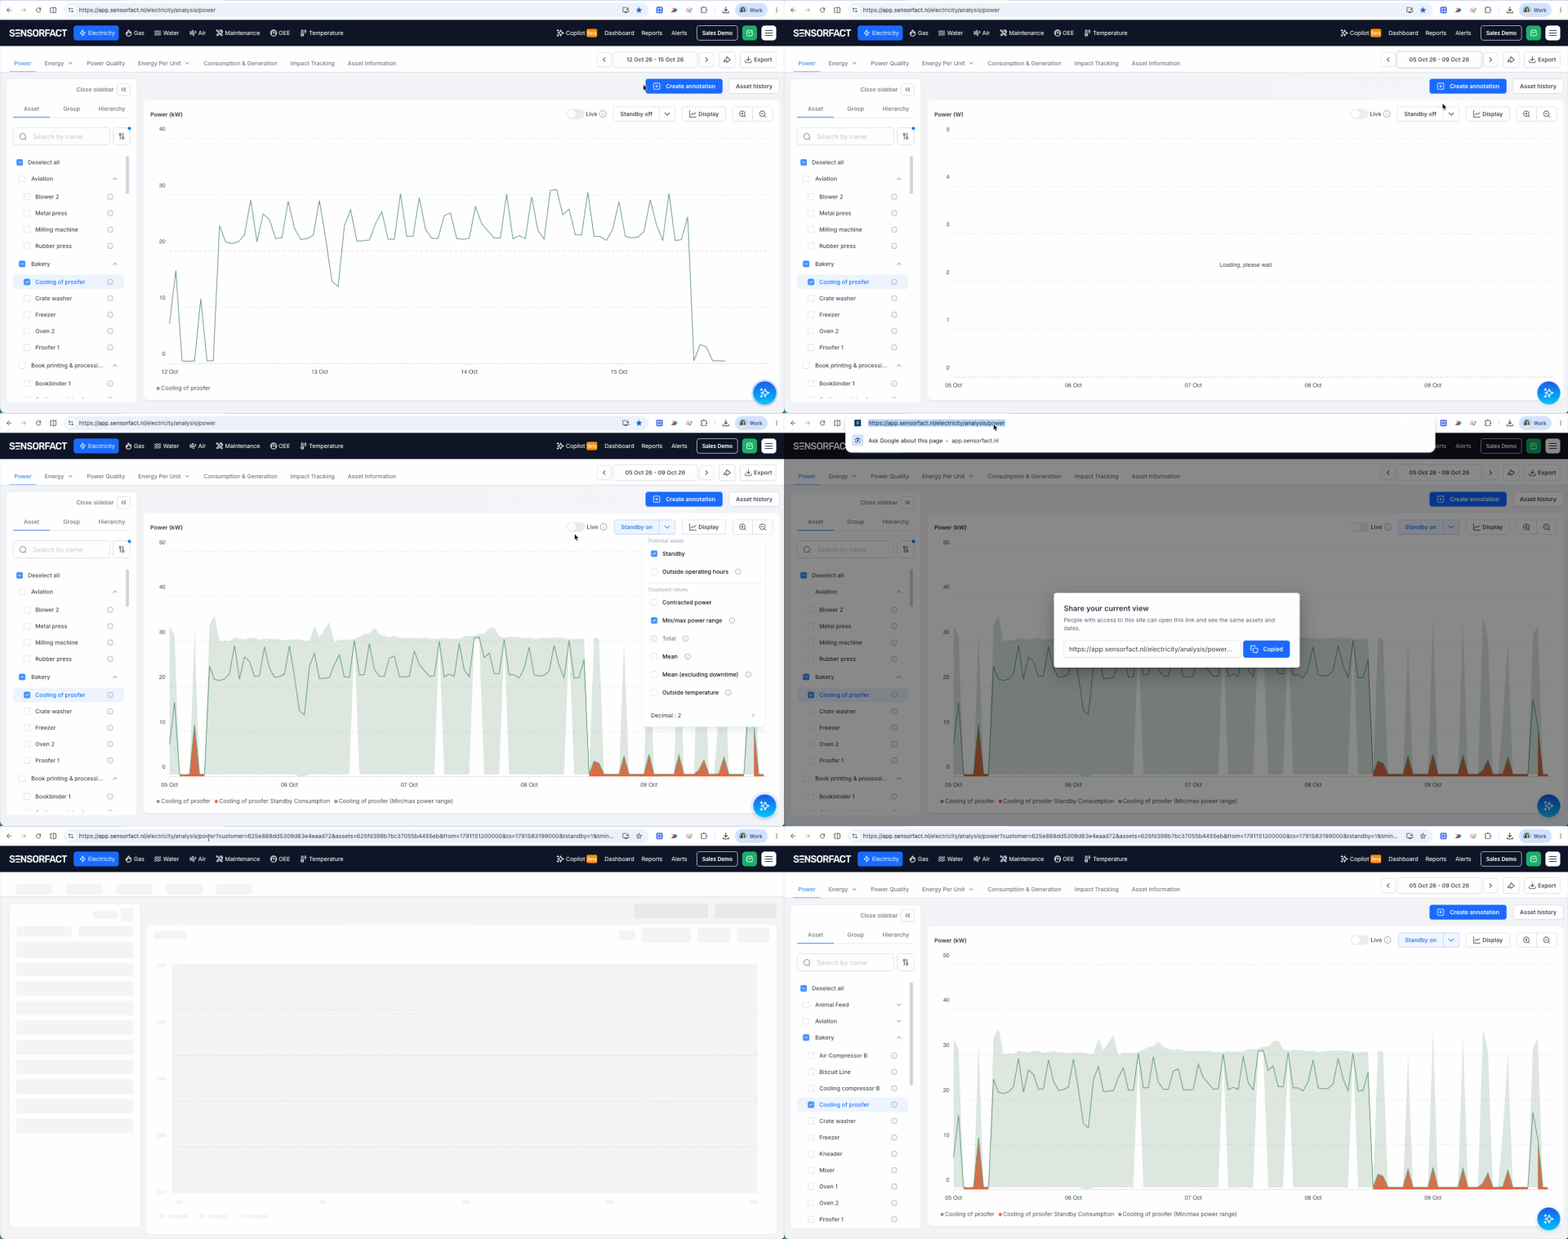
EMS - Share view: Click the new share icon next to the date picker to send a colleague a link to the exact chart you're looking at, with the same assets, dates and toggles. Available on the Power, Energy, Energy balance and Power quality pages.
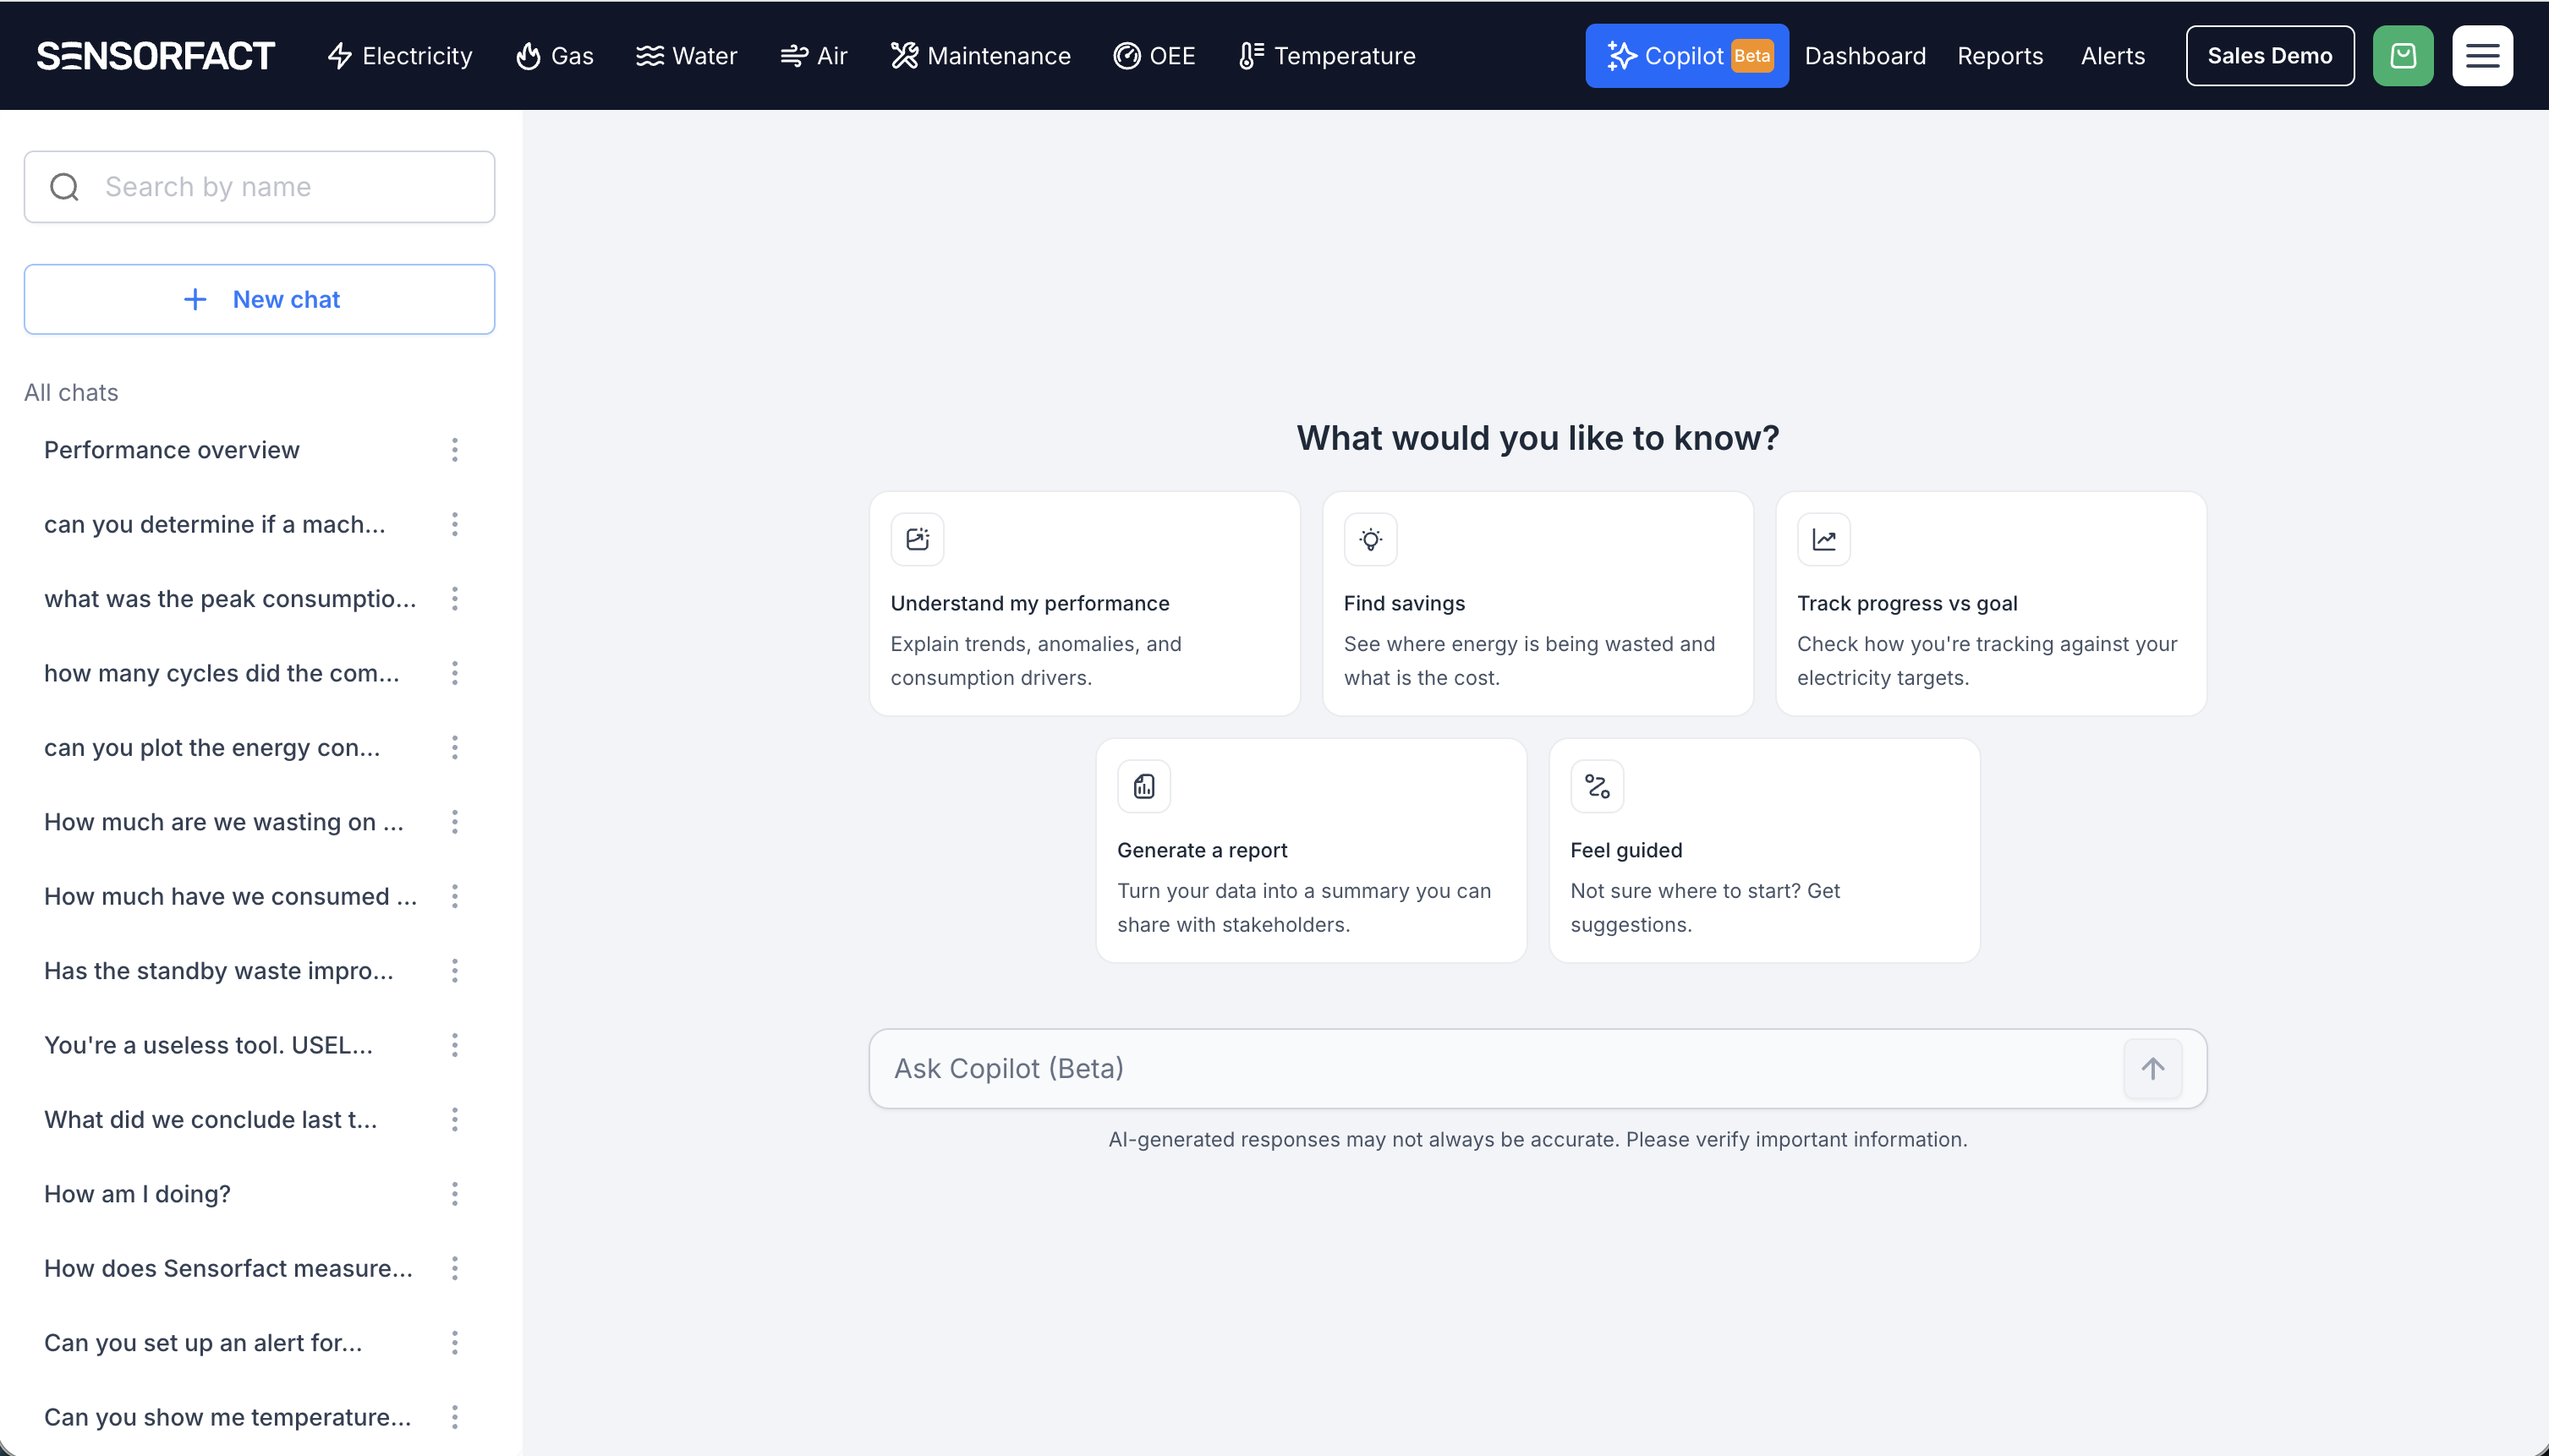
EMS - Starter prompts in Copilot: Not sure what to ask? Click one of the topic cards on the full Copilot page, such as Identify savings or Generate a report, and Copilot starts the conversation for you. Copilot is rolling out to all Energy Management customers over the coming weeks.
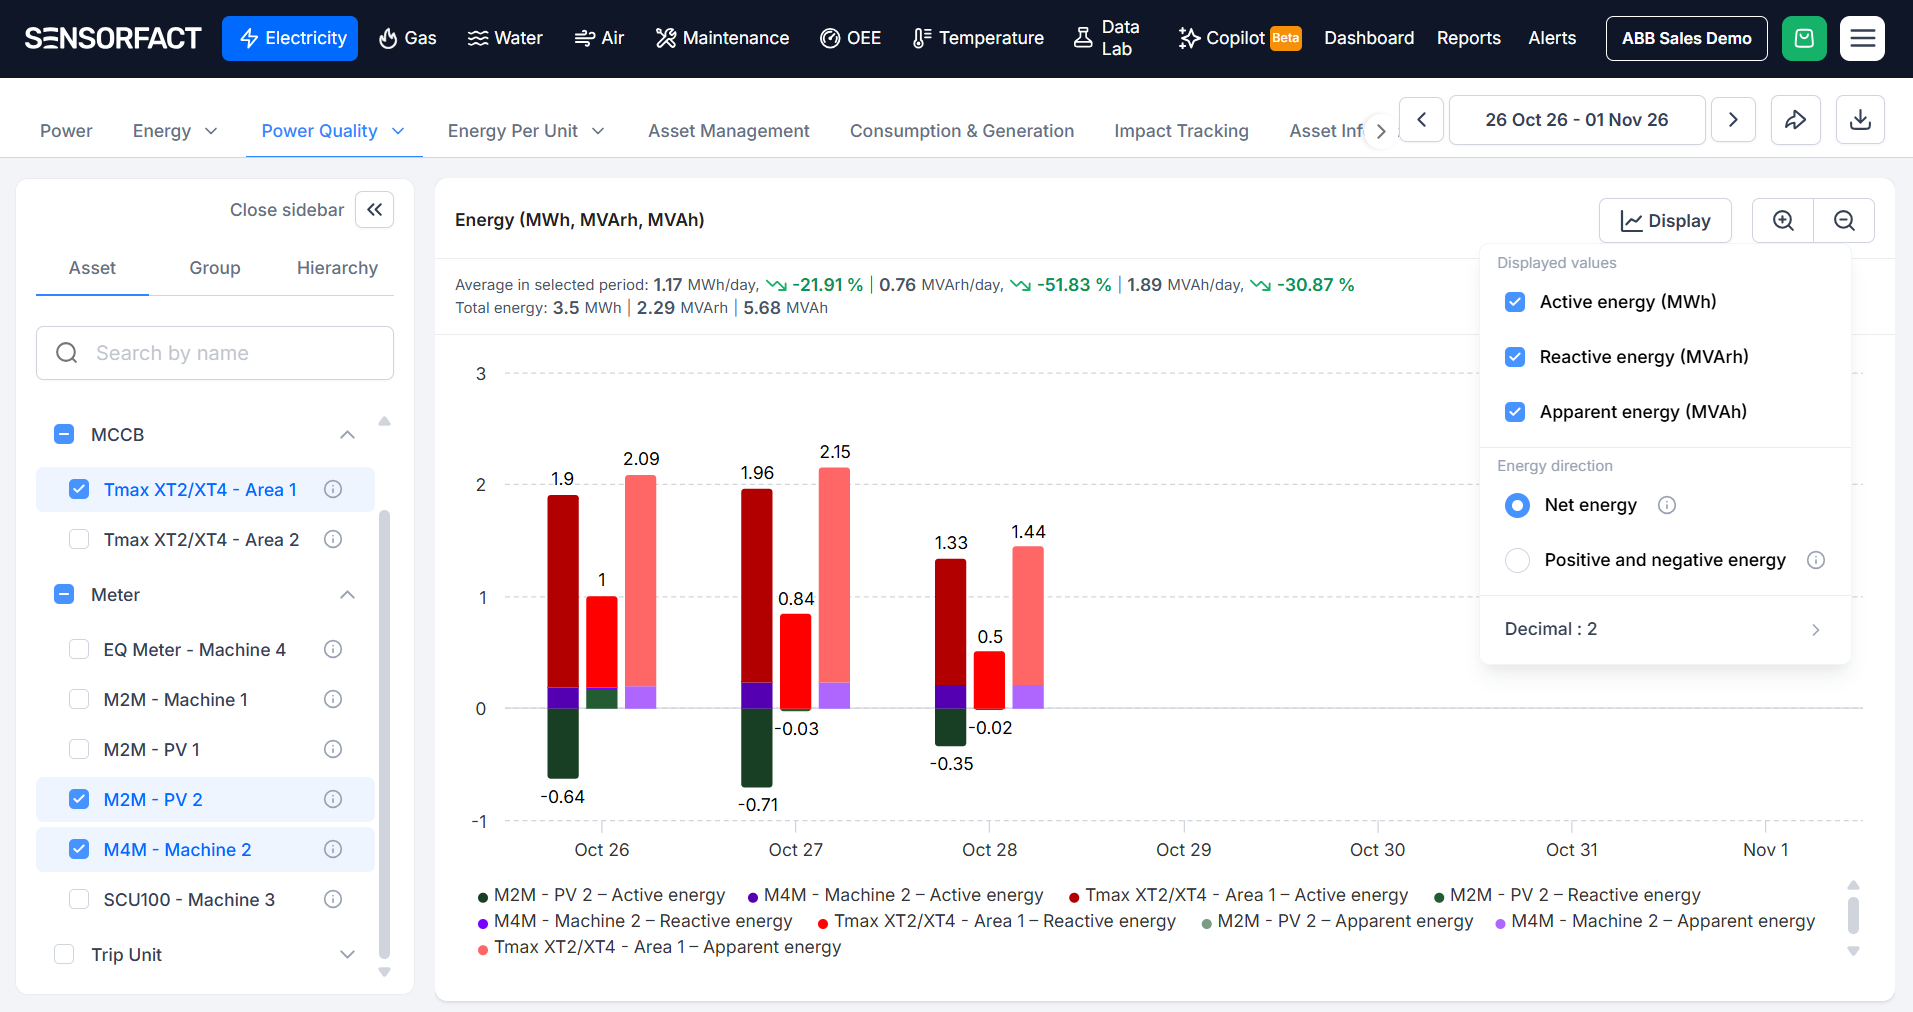
EMS - Apparent & Reactive Energy: A new view under Power Quality shows reactive energy (kVArh) and apparent energy (kVAh) next to active energy (kWh). Find the machines causing reactive energy and check the figures on your energy bill.
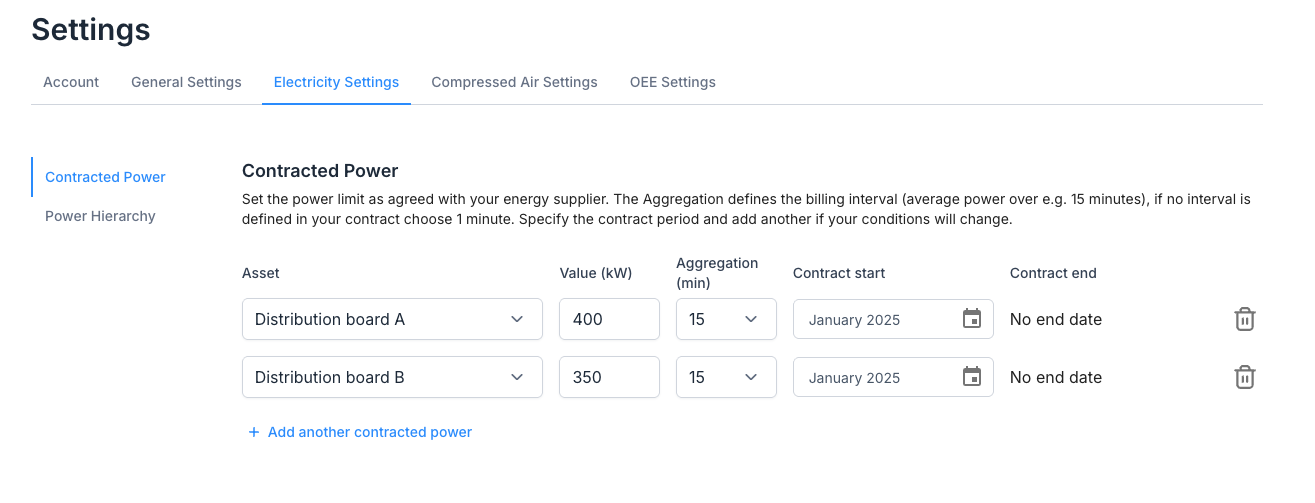
EMS - Multiple contracted powers per site: Sites with more than one grid connection can now set a contracted power for each one, linked to an asset from the Power Hierarchy. Set it up in Contracted Power.
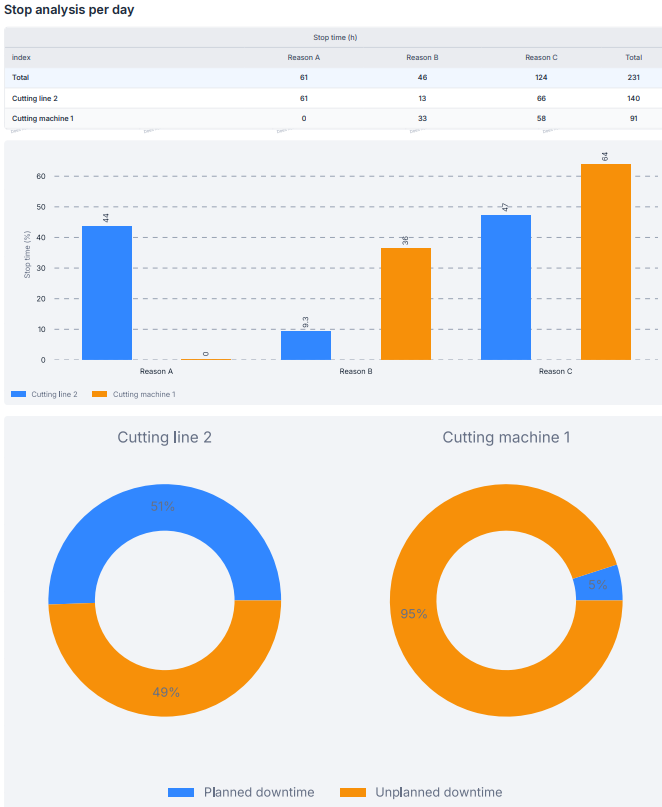
OEE - Stop analysis in Tracking Reports: Add a Stop analysis module to your Tracking Reports to see stop time and top stop reasons per asset or line, as a table, bar chart or the new donut chart.
OEE - Operator tagging: Operators can now add their name when they explain a stop, so you can see who explained each stop on the Stop Analysis page. No login needed, so it works on lines with a shared account. Turn it on in Settings → OEE Settings → General. 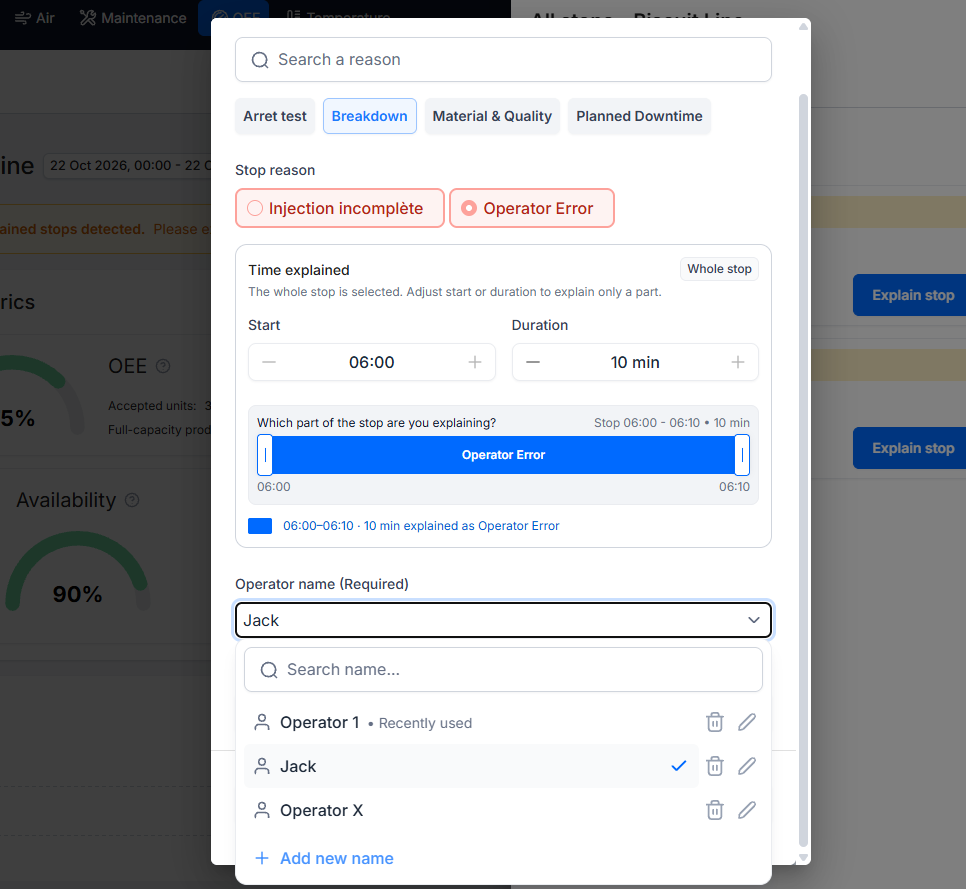
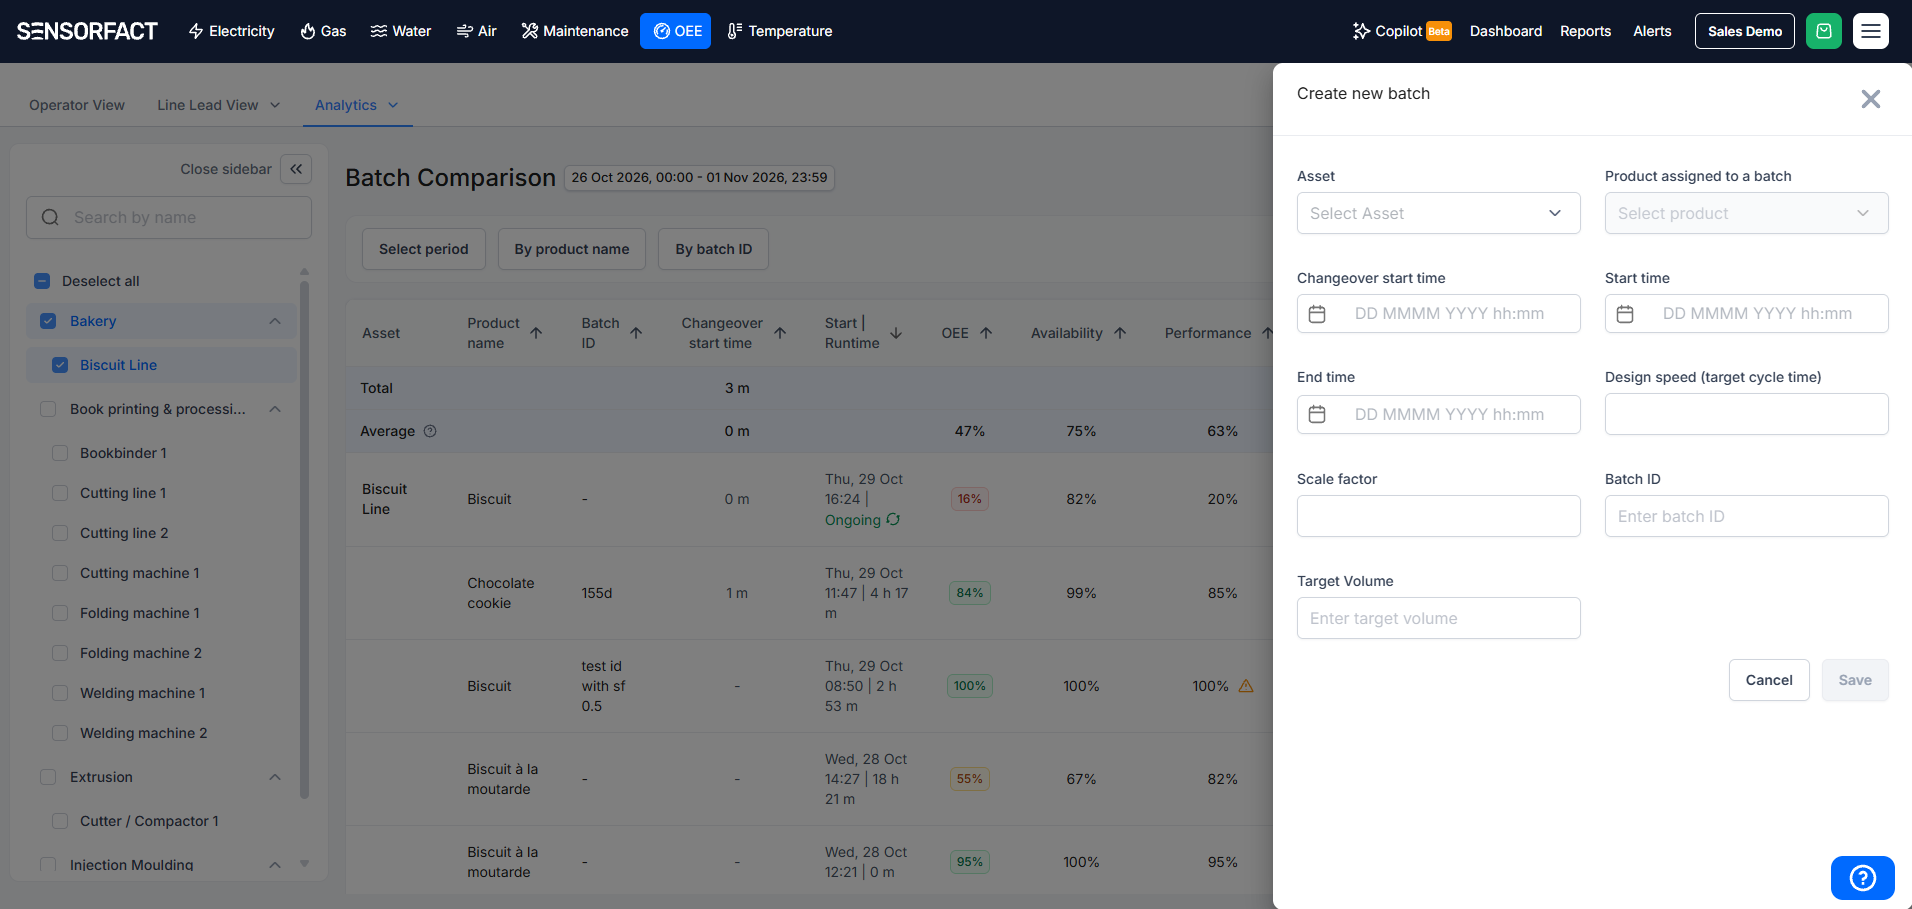
OEE - Correct and add batches afterwards: Fix wrong times, design speed or scale factor on finished batches, or log a batch that was never started. OEE is recalculated on the corrected data. Find it in OEE → Analytics → Batch Comparison.