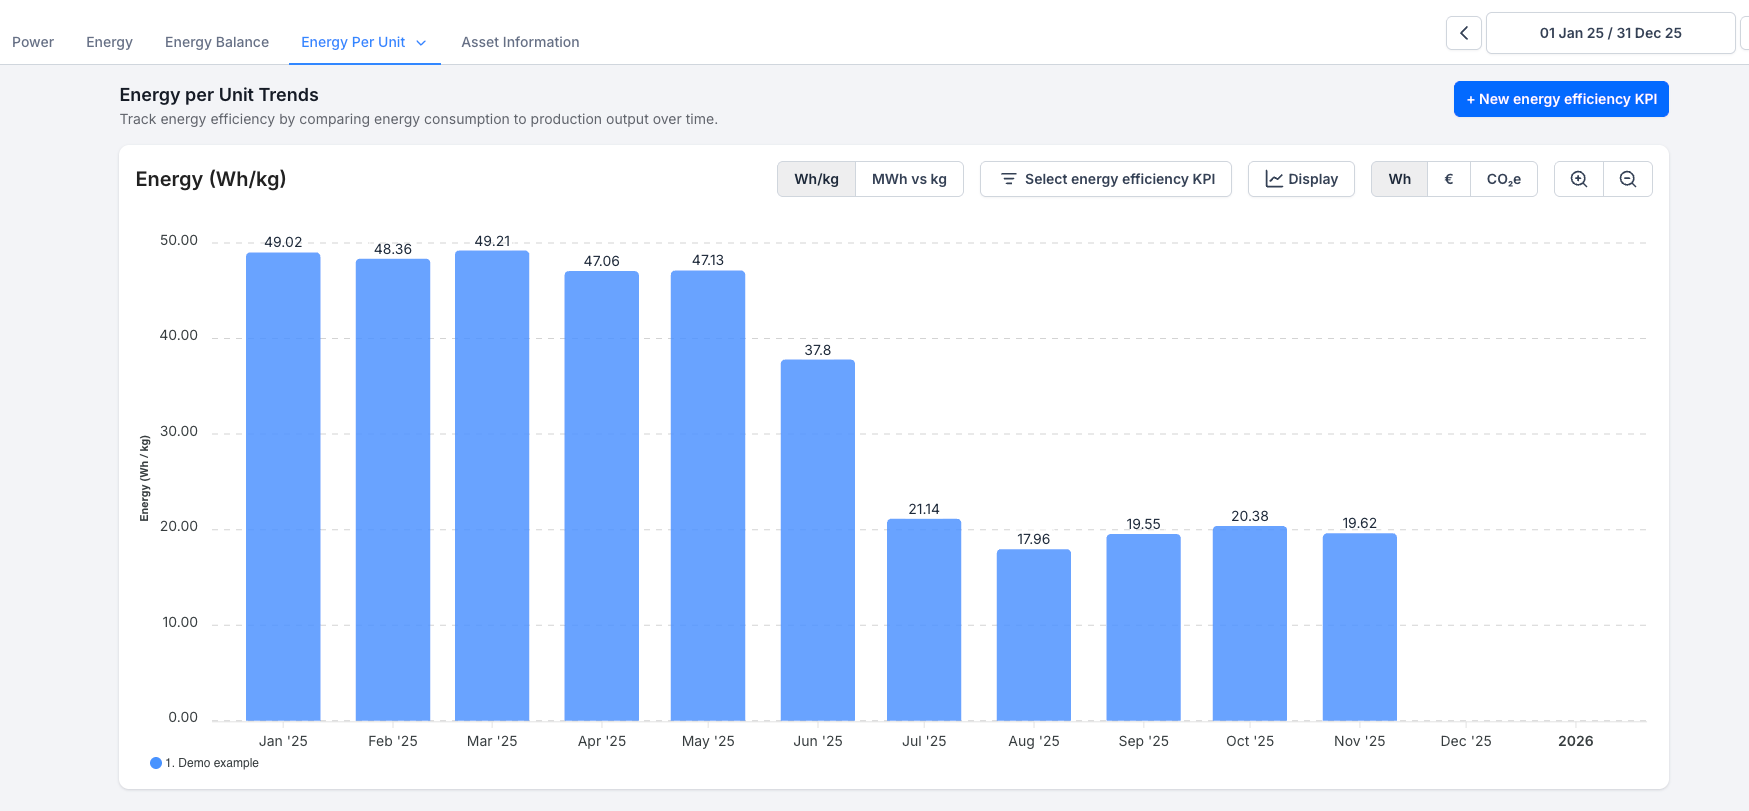
- EMS + OEE - Energy per Unit Trends: The new Energy per Unit Trends feature allows you to monitor energy efficiency trends by comparing energy consumption to production output over time. Create one or multiple energy efficiency KPIs (also referred as EnPI in ISO 50001) for your plant, production line or asset type. Once created, you can view the KPI on the Energy per Unit Trends page. Go here to read more.
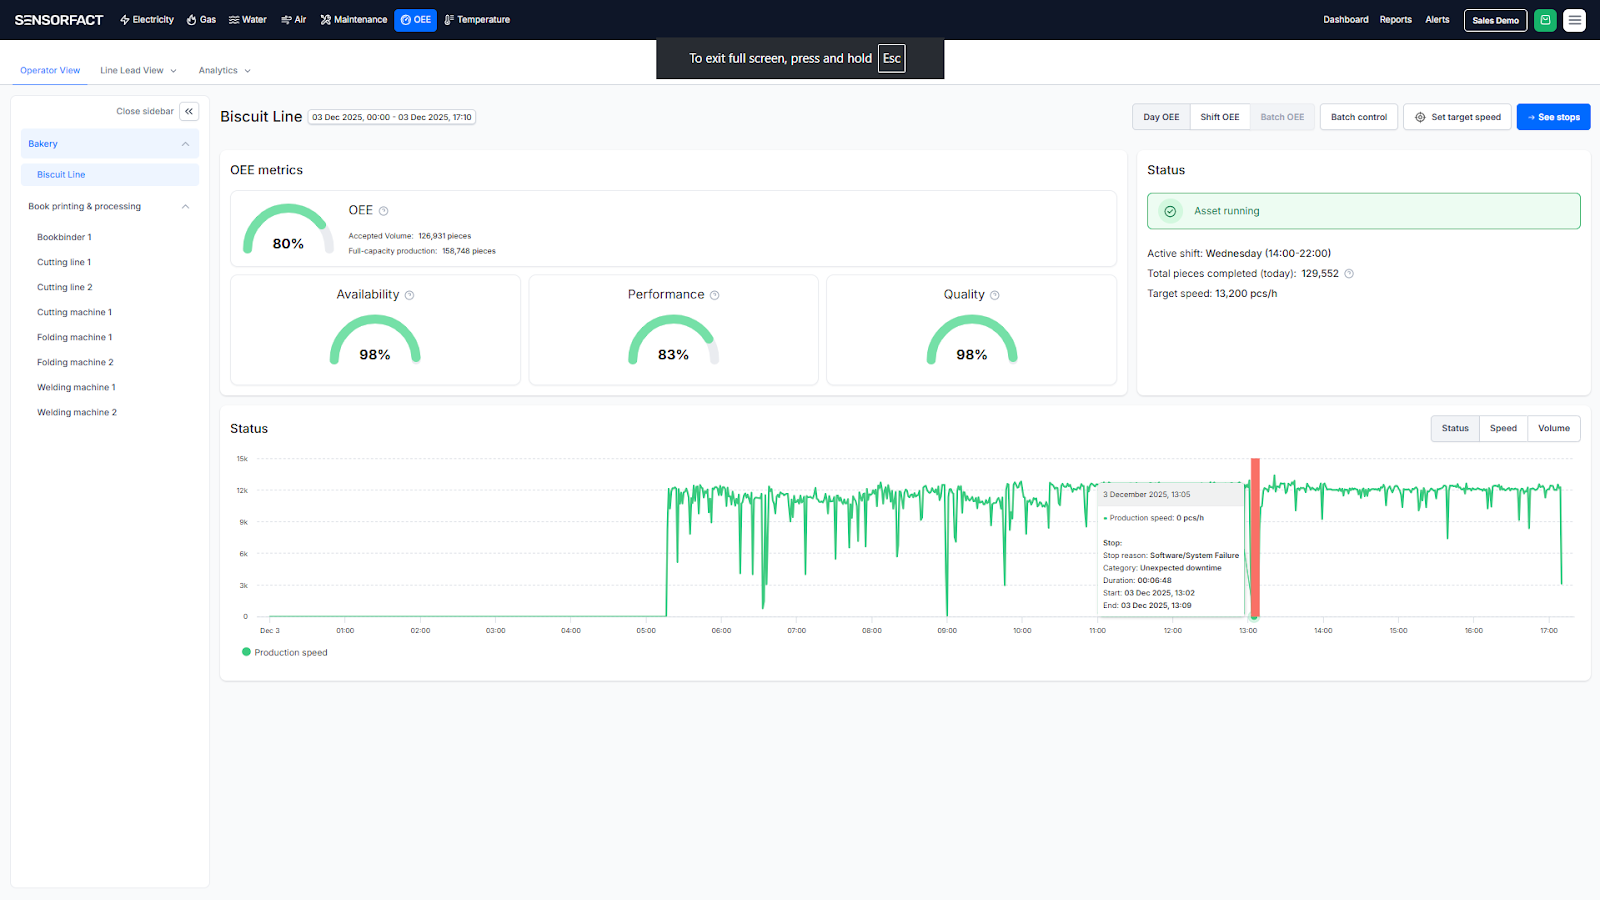
- OEE - Visualized Stops in OEE Operator View: Stops are now visualized directly on the Operator View. When a stop occurs, you can see the exact time it happened and easily click the highlighted area to enter a stop reason. The stop reason's colour will automatically reflect the assigned stop category. This visual enhancement makes it intuitively clear when production stops occurred, leading to faster and easier workflow for operators.
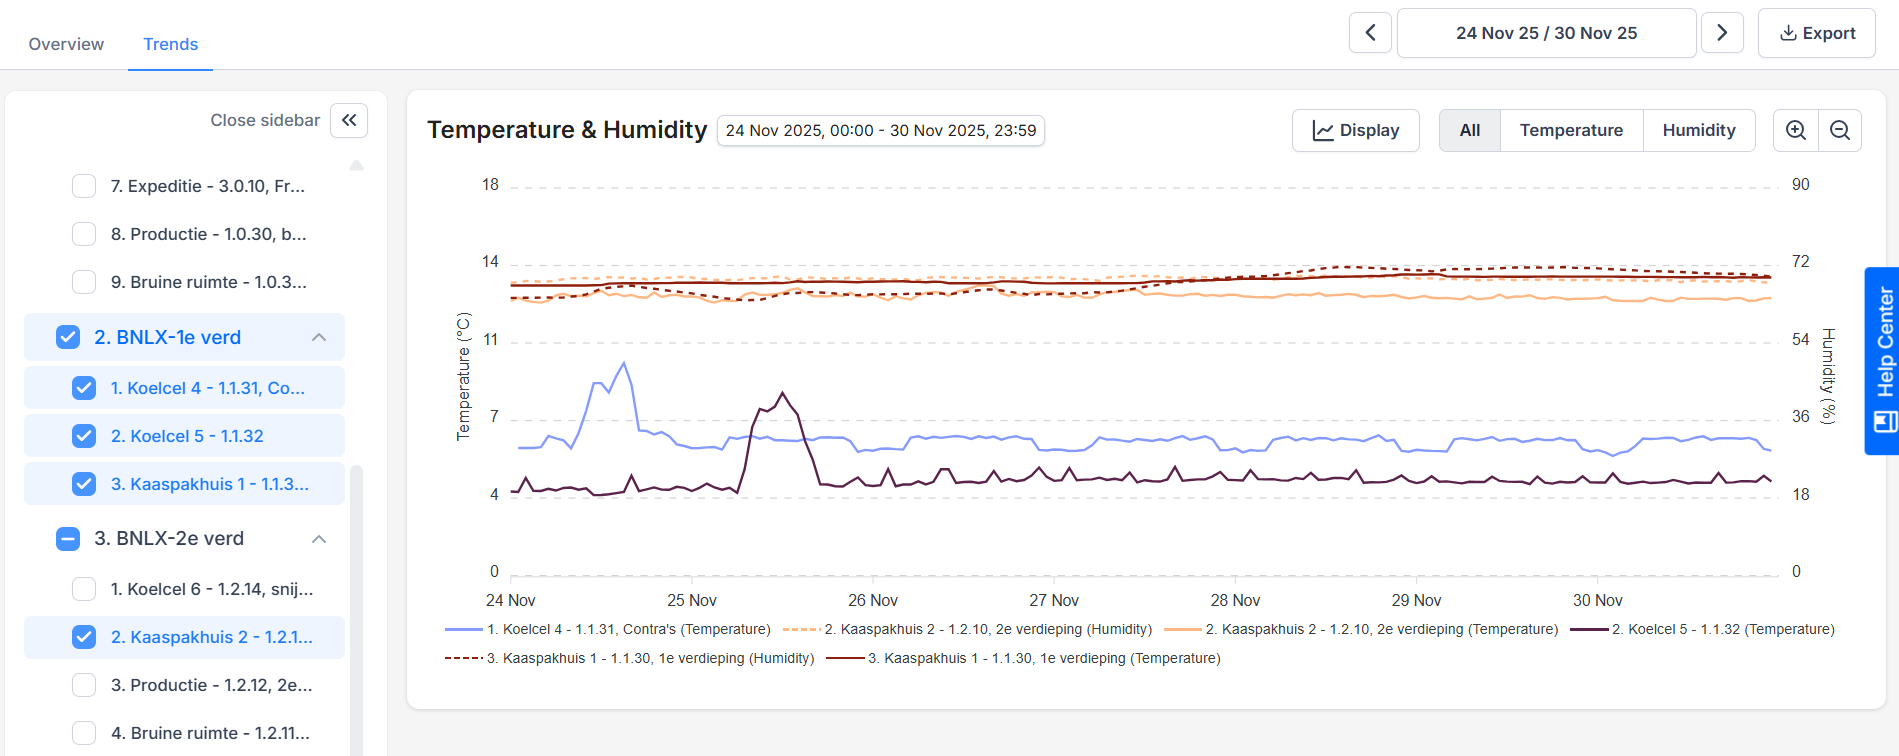
- Temperature - Multiple assets: You can now compare multiple assets in one graph, which makes it easier to compare Temperature and Humidity data with each other.