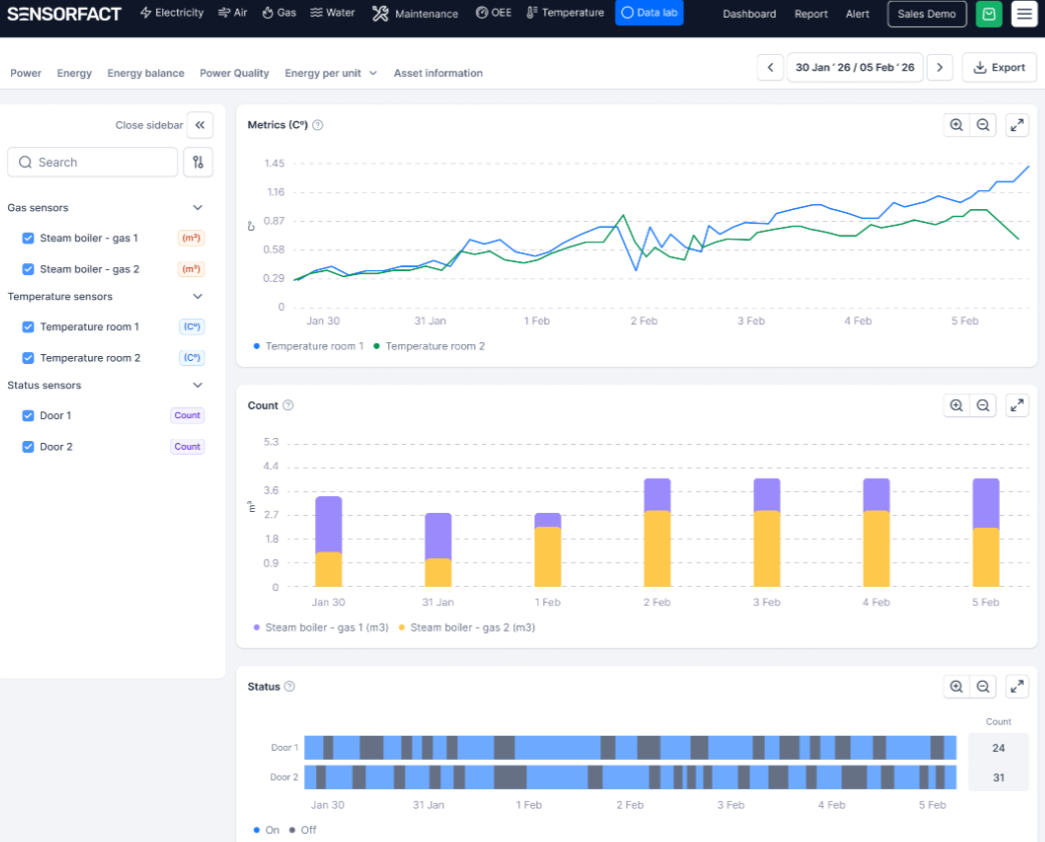
Generic – Interactive Facility Maps: Upload floor plans, machine schematics, or cabinet layouts to overlay physical hardware locations with live status indicators. Maintenance teams can instantly pinpoint exactly where an offline sensor or gateway is located on the plant floor, drastically reducing troubleshooting and resolution times.
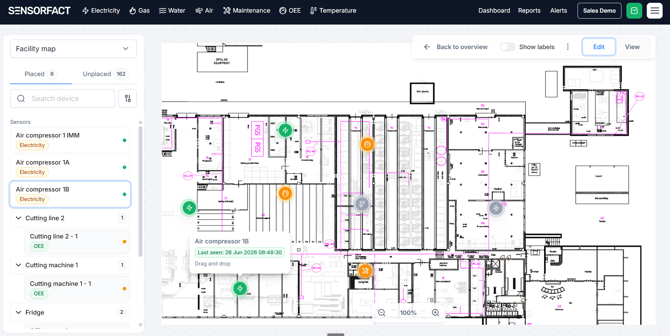
EM – Time-of-Use (ToU) Electricity Rates: Move beyond flat-rate assumptions with support for variable weekly pricing grids and pre-loaded regional country templates. Your energy cost calculations will precisely reflect peak and off-peak contract variations, providing a much more accurate picture of true financial expenditures.
EM – Energy per Unit in Tracking Reports: Seamlessly embed energy efficiency metrics into your automated reporting workflows. This allows you to benchmark the energy intensity of different production processes over time—aggregating data by day or week—ensuring your most critical efficiency indicators are delivered directly to key stakeholders.
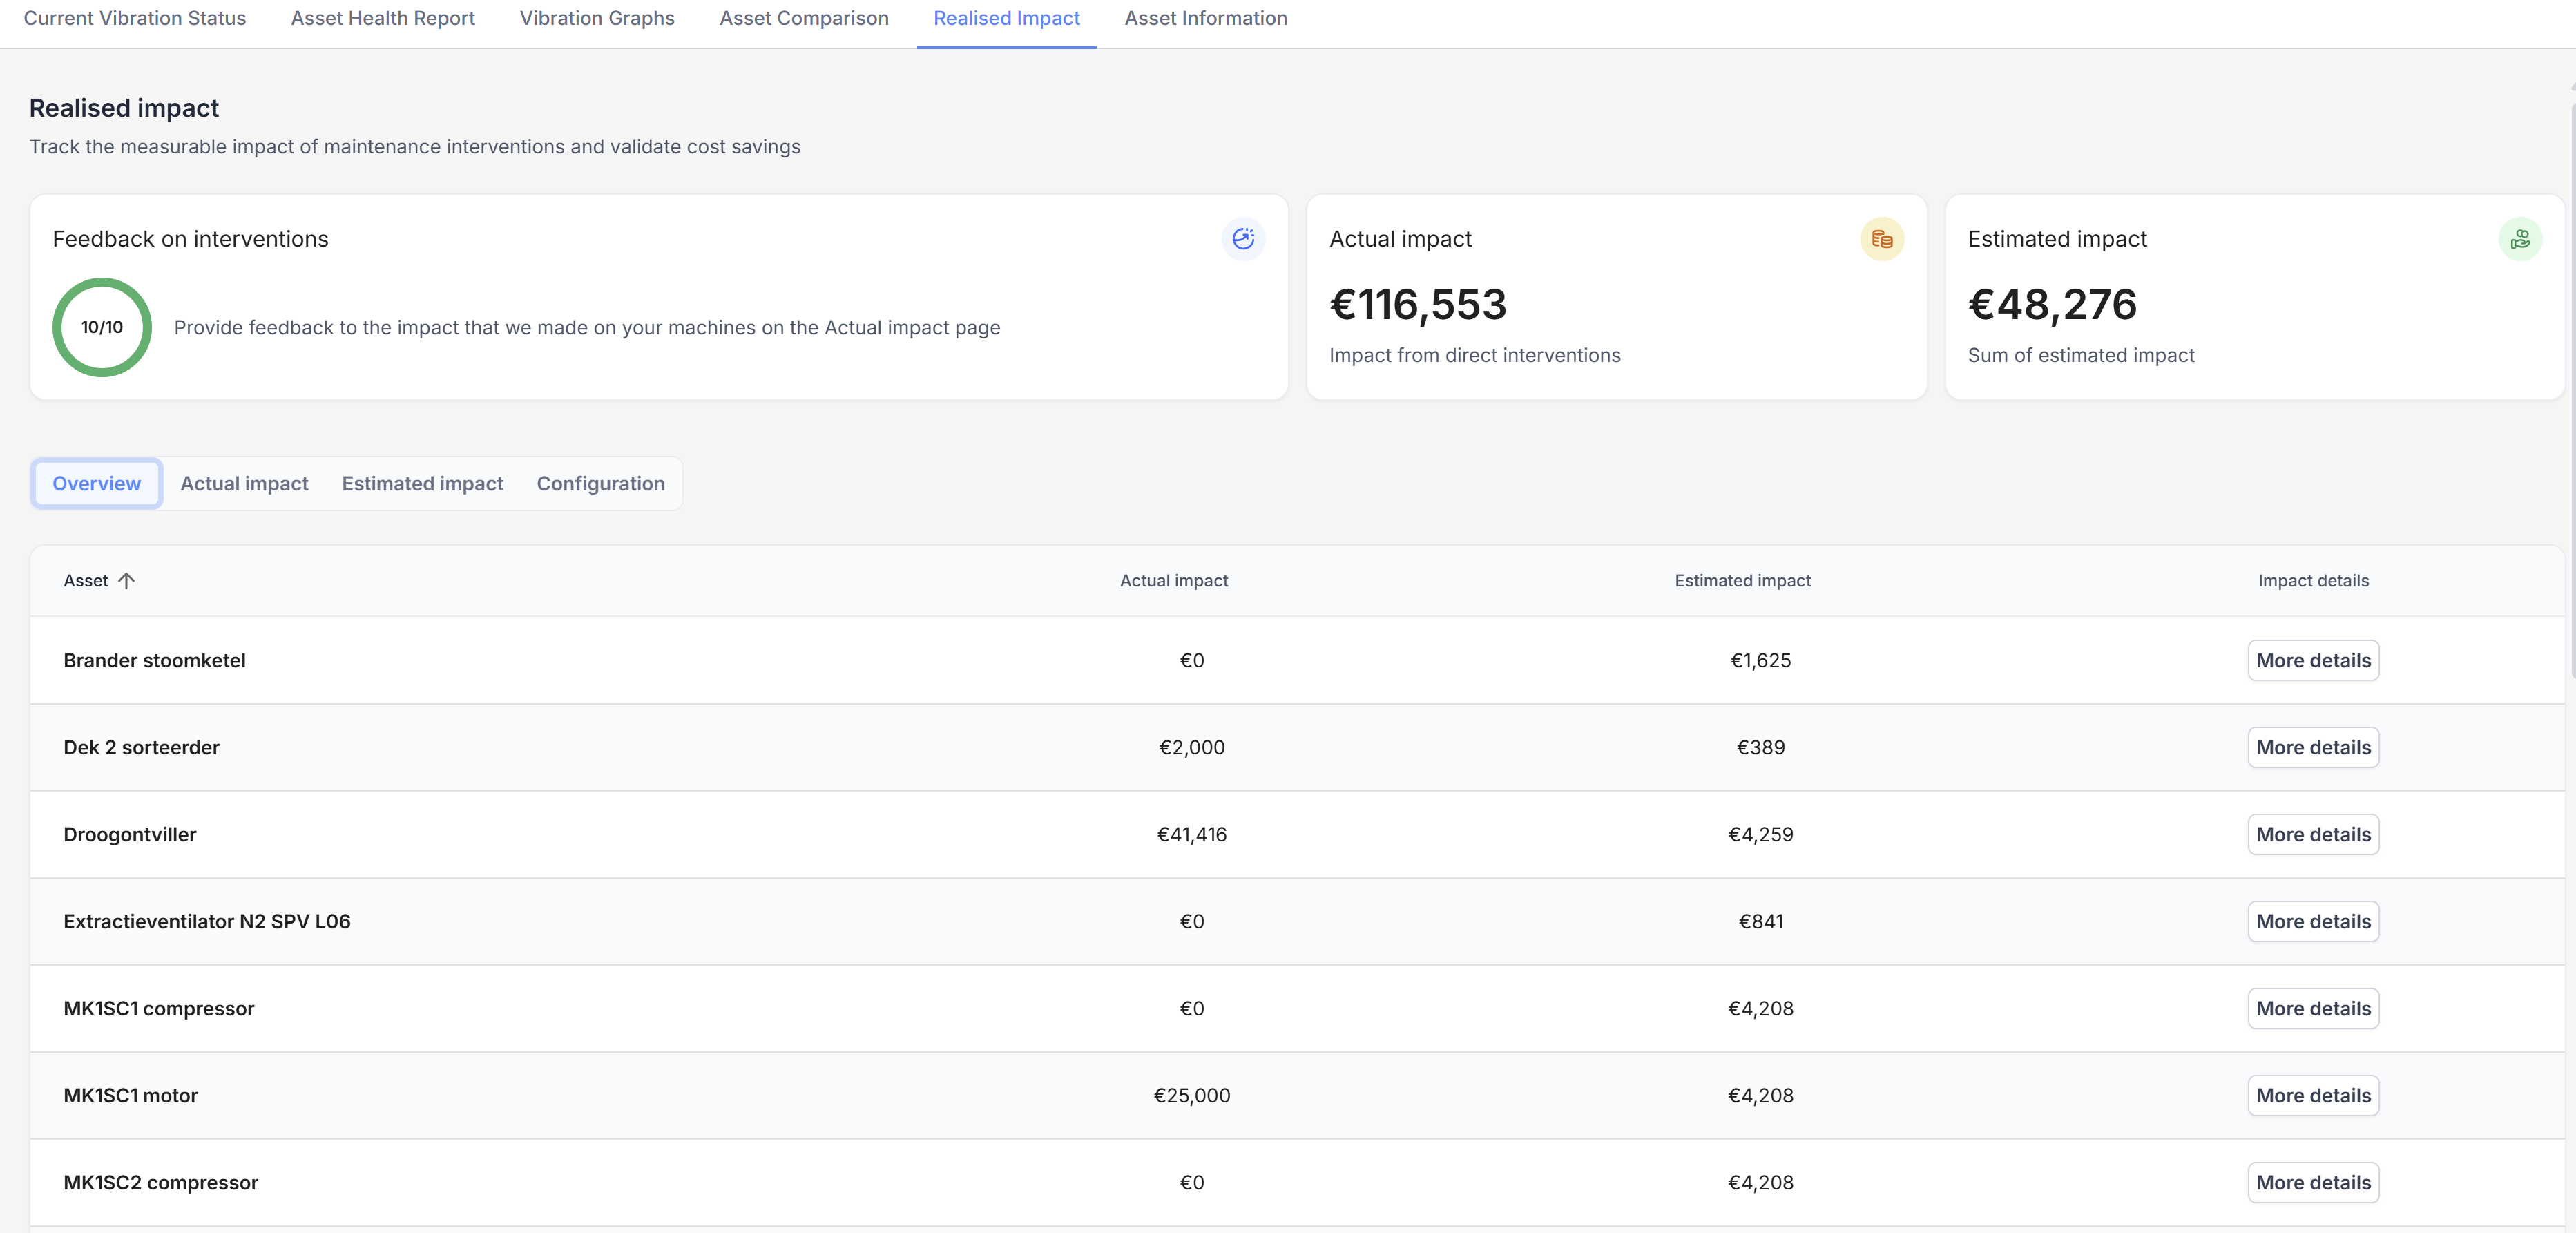
PdM – Financial Impact Tracking: Justify investment and quantify the real-world value of your predictive maintenance strategy with a dedicated financial impact dashboard. This allows you to continuously track direct savings from resolved machine anomalies (like bearing damage) alongside estimated preventive value based on your asset's monitored days and typical failure rates.
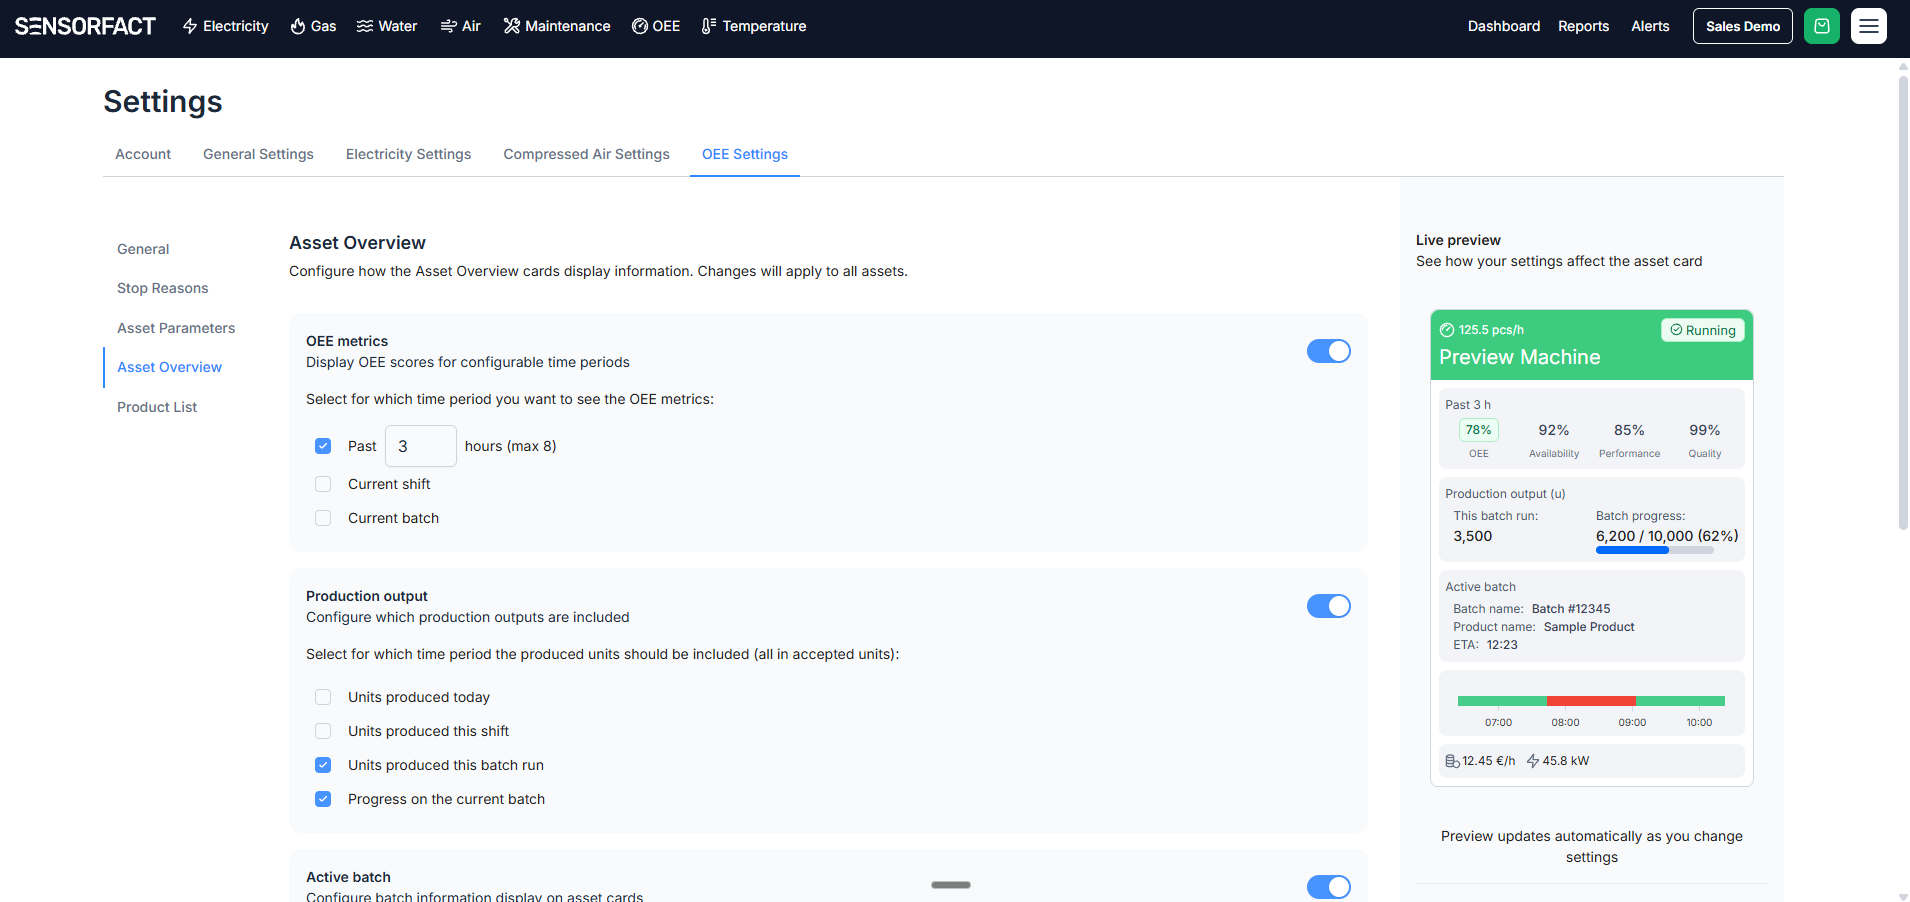
OEE – Configurable Asset Overview Cards: Customize your high-level monitoring dashboard to show only the information that matters most to your specific facility. You can toggle and rearrange live OEE windows, batch progress, shift output, and power consumption metrics to create a scannable view optimized for their unique operational needs.
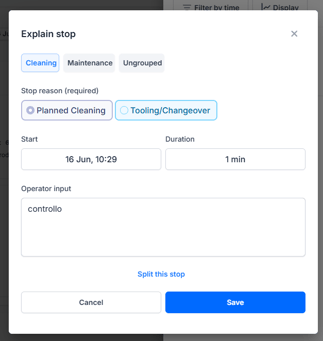
OEE – Two-Step Stop Reason Grouping: Organize downtime reasons into logical, named categories to simplify root-cause analysis. This provides operators a cleaner, faster selection flow that reduces screen clutter, while plant managers gain the ability to analyze high-level downtime patterns before drilling into specific issues.
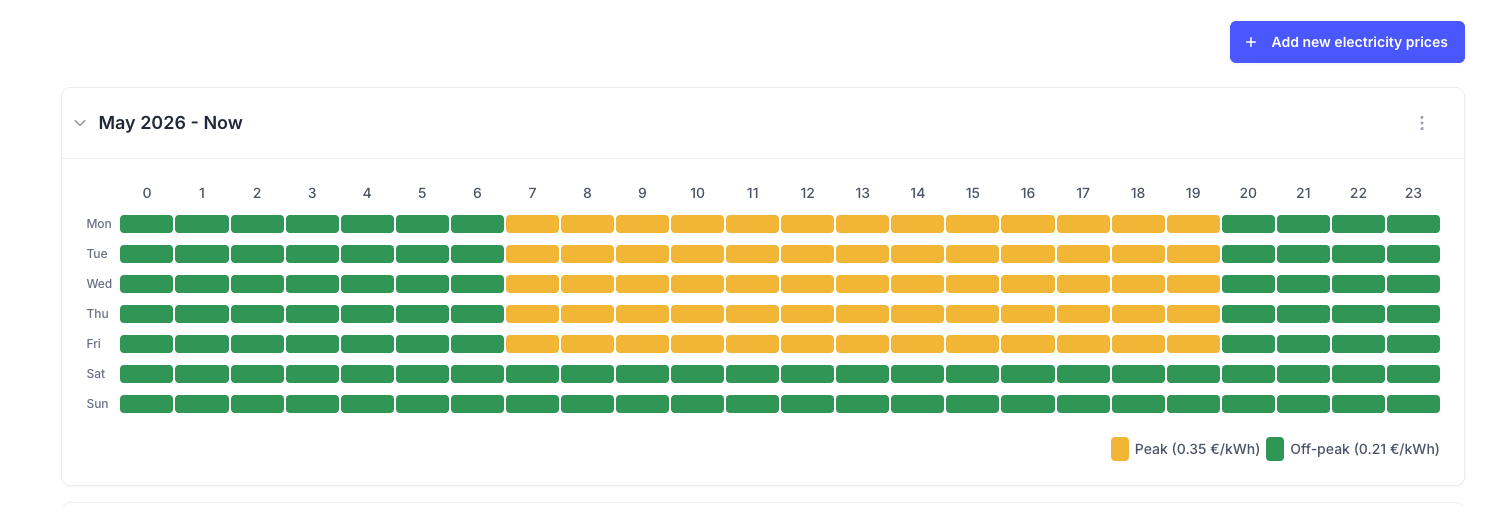
AM – Data Lab (ABB IO Integration): Centralize your operational data by bringing generic signals signals (via ABB IO modules) directly into your main dashboard framework. You can visualize new continuous data, pulse counts, and binary statuses—such as temperature probes, external gas meters, and third-party circuit breakers—without needing standalone software.