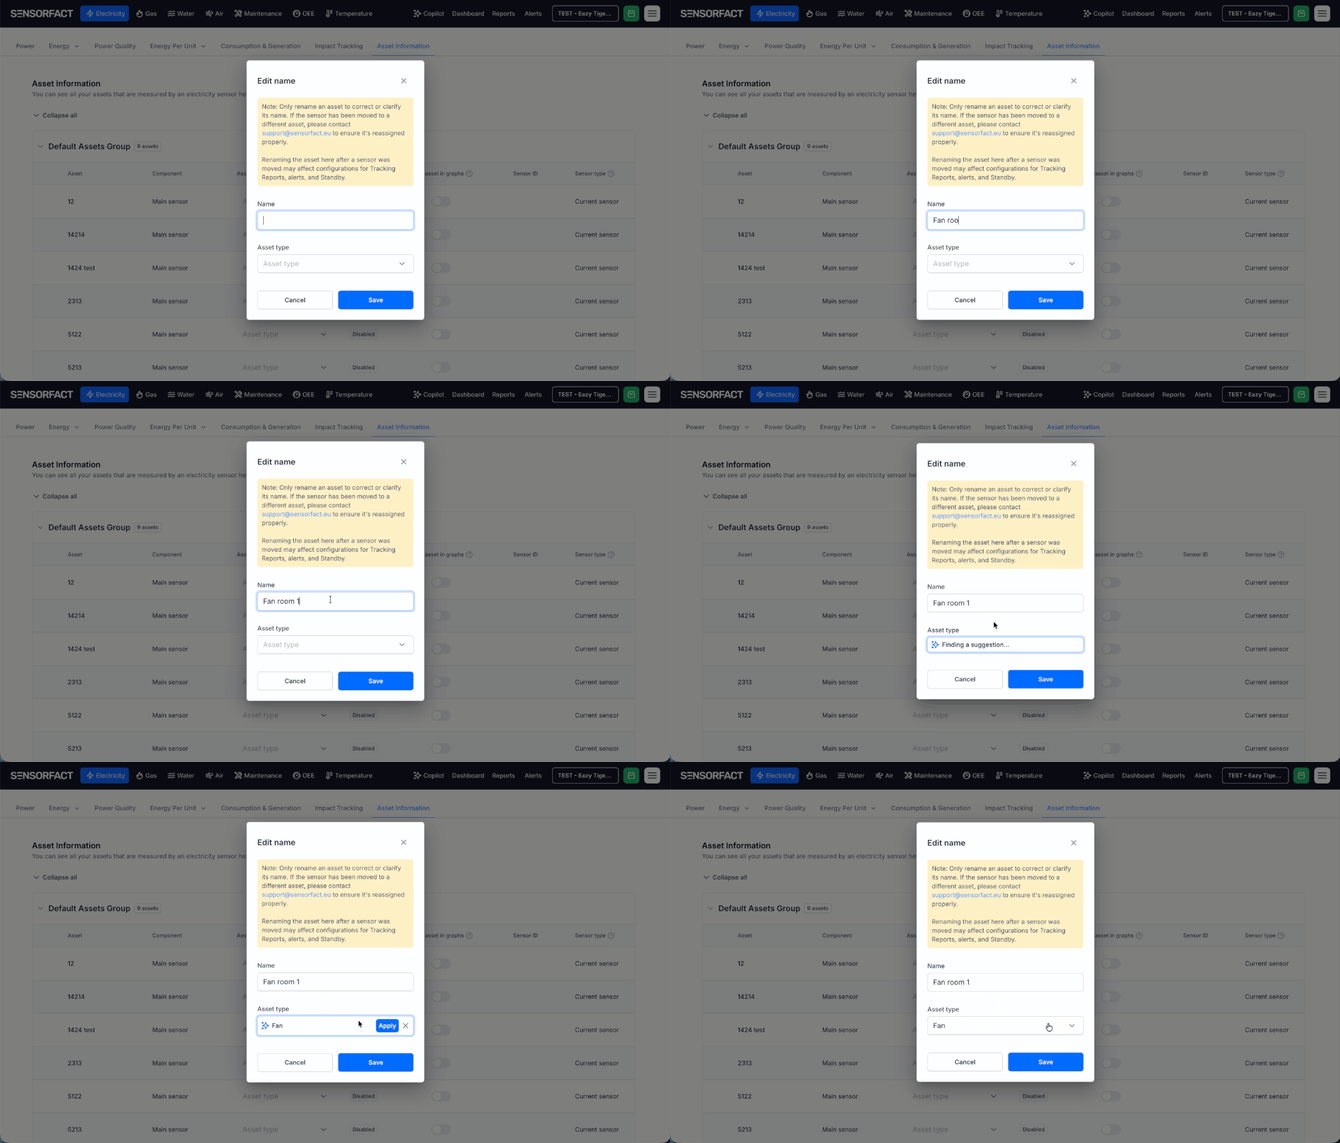
General - Asset type suggestions and inline editing: Asset types are now editable in the platform, with a suggested type appearing as soon as you enter or change an asset name. Because the asset type is the context behind every measurement, keeping it accurate sharpens grouping, comparison, benchmarking and analysis, and now takes seconds instead of submitting a request. Available in onboarding, the Status page, the Asset information page, Power hierarchy settings and Group management. Read more
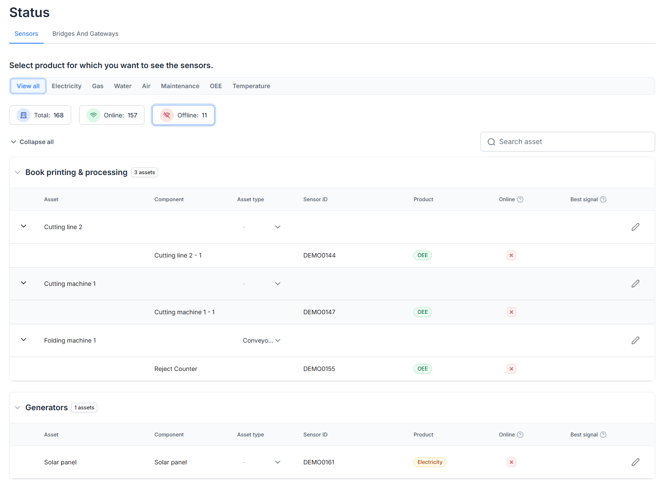
General - Online and offline filters: Filter all assets by Online or Offline on the Status page, and on Bridges & Gateways, where a Teltonika toggle isolates those bridges. One click on a tile shows you exactly which assets need attention, instead of scanning the full list during troubleshooting or onboarding.
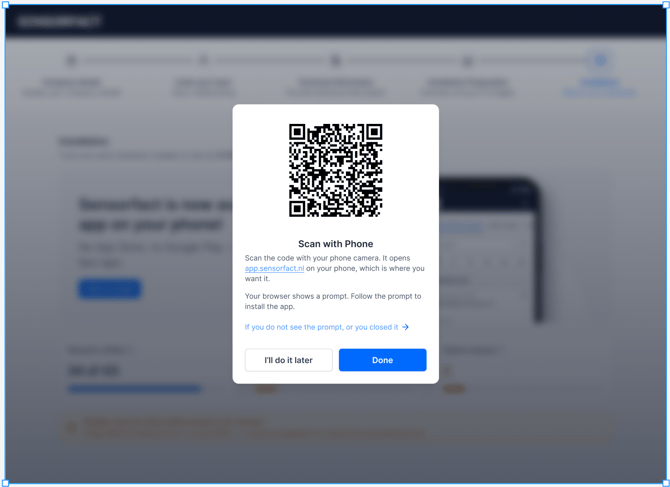
PdM - Predictive Maintenance on your phone: Install Sensorfact Predictive Maintenance on your phone and take it to the machine: read the consultant's diagnosis while standing in front of the asset, check vibration data on the spot, and add annotations the moment you notice something. Install it from your browser via Chrome's "Install app" or Safari's "Add to Home Screen"; it is not in the App Store or Google Play.
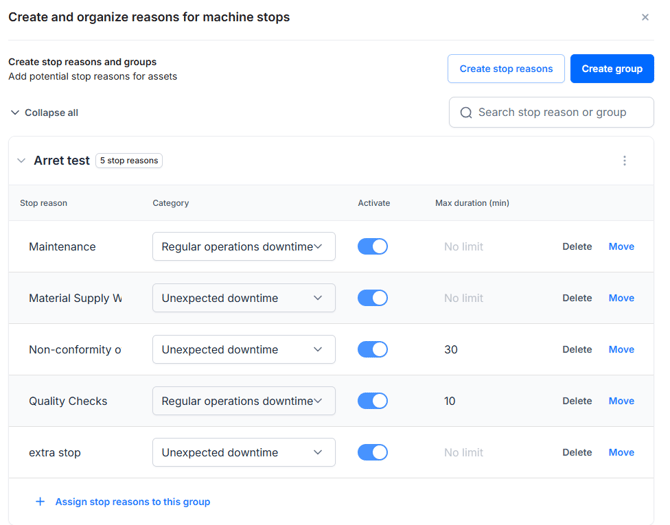
OEE - Duration limits for stop reasons: Set a maximum duration on any stop reason, for example 30 minutes for "break" or 2 hours for "cleaning". Anything beyond that limit has to be explained separately, so convenient catch-all reasons no longer hide real downtime and your loss analysis stays accurate. Configure it under OEE Settings → Stop Reasons → Manage Stop Reasons.
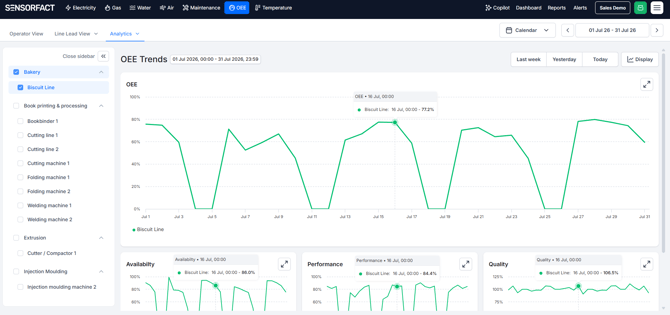
OEE - OEE Trends page: The new OEE Trends page under OEE Analytics shows how OEE, Availability, Performance and Quality develop over time per asset, rather than only per batch or shift. Four synchronised charts make it clear at a glance whether your scores are improving or slipping and which component is driving it, with a date range selector and period comparison built in.